14 Best APM Tools In 2025 (Application Performance Monitoring Tools)
Are you looking for best Website and Application Performance Monitoring APM Tools?
Software is a critical component of every business these days. Priority #1 is to ensure that your mission-critical applications run at their best every time. For developers, DevOps, and traditional IT operations, there are many tools for application performance monitoring (APM).
There are many gray areas regarding APM and its benefits to an organization. This post will explain what APM is and give some tips on how to choose a tool. It also lists the top application monitoring tools with their features.
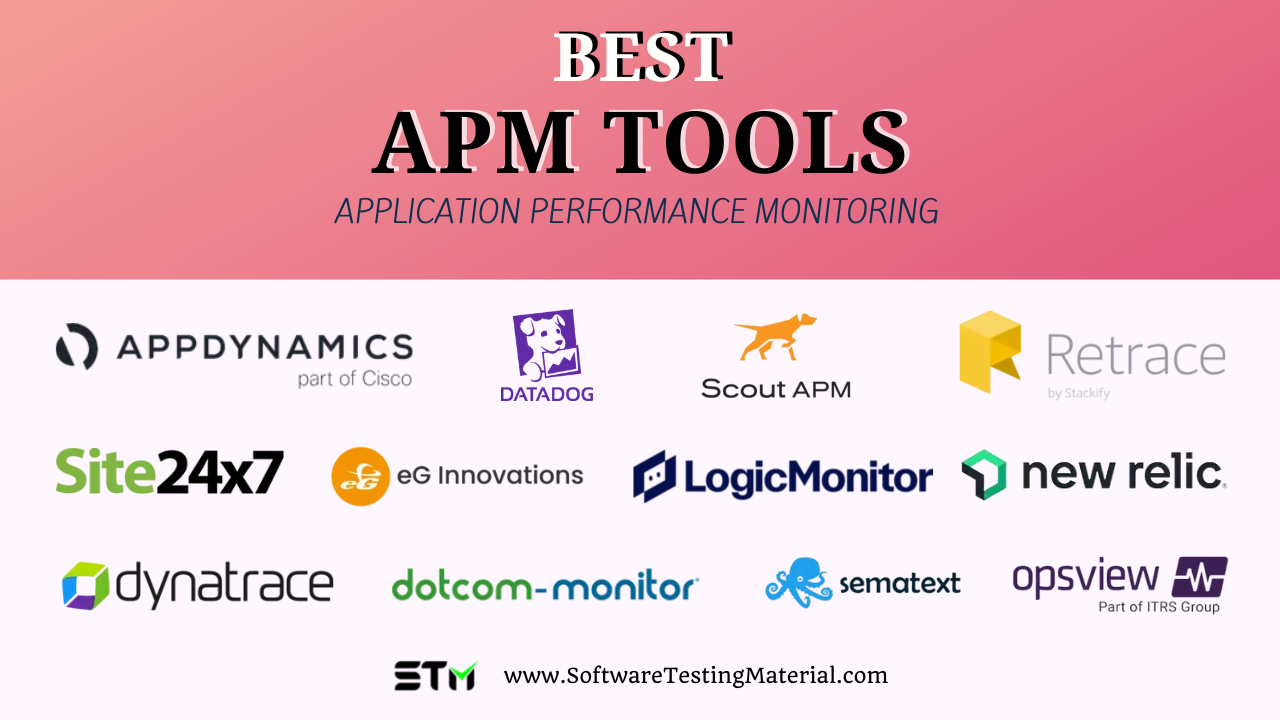
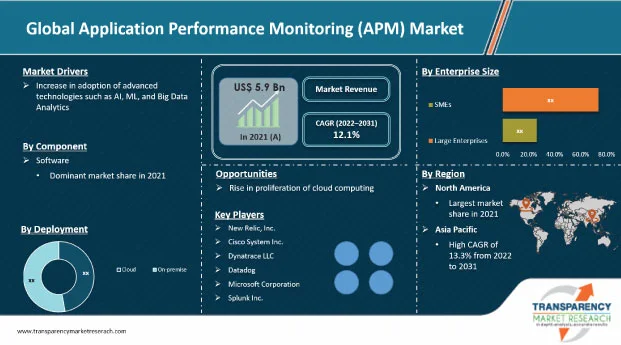
What are APM tools?
Application performance monitoring (APM) is a technique that monitors key metrics for software applications using monitoring software and telemetry data. APM is used to improve system availability, service performance, response times, as well as user experience.
Monitoring is common in mobile apps, websites, or business applications. Monitoring is now possible in today’s digitally connected world. This includes monitoring the applications, processes, hosts, and logs as well as end-users who access them, including customers and employees.
Application performance monitoring (APM) tools monitor your websites, microservices, and infrastructure 24/7. It then analyzes the situation with Artificial Intelligence (AI) in order to identify issues. These tools allow you to quickly determine which part of your infrastructure is the problem and how it affects other parts.
The components of a complete solution for application performance management:
- Execution of individual web requests and transactions
- Performance and use of all dependencies such as web services, databases, caching, etc.
- Detailed transaction trace down to particular lines of code
- Code level performance profiling
- Basic server metrics like CPU, memory, etc
- Metrics for custom applications created by the business or dev team
- Application log data
- Application errors
- Real user monitoring
Which factors to consider while choosing an APM tool?
Traceability: Not only should the tool send out an alert when a problem is detected, but it also needs to show the reason and whereabouts. Some tools even allow you to see which section of the source code is problematic.
Performance Metrics: Verify that the tool can provide metrics on the following:
- Rate of transaction processing
- Response time
- Page loading time
- Load the host machine
Automated updates: The question now is: Do you need to restart the host or other services that are running on the server after the APM tool has been updated? It is likely that it will be a frustrating experience. It is also a sign that the APM tool has become obsolete. Modern APM tools are self-updating and do not need to be restarted.
Data Granularity: What speed can the APM tool capture stats and logs quickly? The faster the tool can collect more detail and quickly analyze it, the quicker the issue detection can occur.
List of Top 14 Application Performance Monitoring Tools
#1. SolarWinds (Recommended)
Best for health monitoring of server and application.

The product was originally called Tracelytics and was later acquired by AppNeta. It is now part SolarWinds. Traceview provides infrastructure support tools that all share the same platform. It offers a deep insight into your applications, a better end-user experience, and is an inexpensive performance monitoring tool.
Features:
- Full-stack application performance monitoring: SolarWinds Observability monitors your applications end-to-end — combining data from applications, services, infrastructure (servers, containers, VMs), databases, and network layers — all within a single platform.
- Unified data collection (metrics, logs, traces & user experience): It gathers diverse telemetry — including performance metrics, logs, distributed traces, and user-experience data — giving one holistic view that helps you quickly spot and diagnose issues.
- Distributed tracing for deep insights & root-cause analysis: The APM module can trace individual transactions across multiple services — showing you how a request travels through microservices, databases, or external APIs. This helps locate exactly where latency or errors originate.
- Support for cloud-native, hybrid, containerized and legacy environments: It works with a variety of environments — from traditional on-premise servers to modern cloud-native architectures (containers, Kubernetes, serverless) — making it suitable for mixed infrastructure.
- Single-pane-of-glass observability for teams (DevOps, IT Ops, Cloud Ops): By combining infrastructure, application, database, network and user-experience data into one interface, it helps break silos between teams and makes collaboration easier.
- Faster problem detection and resolution: Because metrics, logs, traces and dependency data are correlated — you get a “single source of truth” that speeds up identification and resolution of performance issues, helping you spend more time improving applications than firefighting.
- Scalable deployment: SaaS or self-hosted to fit your needs: You can choose between a cloud-hosted (SaaS) version or self-hosted deployment, which gives flexibility depending on your compliance, security, or infrastructure requirements.
Pricing details: It offers a fully functional 30-day free trial. Pricing starts at US $7 per node per month (self-hosted or SaaS)
#2. ManageEngine Applications Manager (Recommended)
Best for application performance monitoring, infrastructure monitoring, digital experience, and database monitoring.

ManageEngine Applications Manager empowers you to see exactly how your business-critical applications are performing, both on-premise and in the cloud. This comprehensive APM software provides deep insights that help you identify and resolve performance issues quickly, ensuring optimal user experiences and a smooth-running business. Distributed tracing and AI-powered anomaly detection cut through complexity, revealing hidden performance issues before they impact users. Its real-time dashboards offer a clear view of your application’s health, providing actionable insights for proactive problem-solving.
Features:
- Byte-code instrumentation and code-level diagnostics for Java, .NET, .NET Core, PHP, Node.js, Python and Ruby applications.
- Apdex score to measure user satisfaction levels.
- Distributed tracing and waterfall charts to discern slow transactions that are impeding optimal performance.
- Synthetic transaction monitoring from multiple locations for multi-page end-user workflow simulation.
- Real user monitoring to track real user interactions and analyze the experience of organic users.
- Out-of-the-box support for 150+ applications and infrastructure elements.
- Extensive monitoring of hybrid cloud, virtual, and container technologies such as Kubernetes and Docker.
- Intelligent fault management pinpoints root-cause of faults to reduce MTTR.
- Machine-learning-enabled-analytics helps users anticipate future resource utilization and growth.
Trial: Applications Manager offers a free trial for 30 days.
Pricing: Applications Manager is available in two editions – Professional & Enterprise. You can check out their pricing here.
#3. Datadog
Best for an end-to-end distributed tracing and service-centric observation at scale.
Datadog Application Performance Monitoring solution provides end-to-end distributed tracing from mobile apps and browsers to databases and individual lines of code. Datadog APM seamlessly combines distributed traces with backend and front-end data. This allows you to monitor service dependencies and health metrics, reduce latency, and eliminate errors, so your users have the best experience possible.
It also provides cloud-based monitoring of infrastructure, applications, and event logs. This system can monitor hybrid, cloud-based and on-premise systems.
Features:
- Integrate with hundreds of third-party libraries or frameworks to gain unparalleled visibility into Java.NET, PHP, Node.js, Ruby, Python, Go, or C++ applications.
- With minimal overhead, analyze code-level performance across the entire stack to identify your most resource-consuming method (CPU, memory, etc.). Use tags to correlate with the relevant requests and trace.
- It is visually appealing and incorporates graphical data representation to make it easy to recognize status. Switch between views to see the top-end users and zoom in on specific users to view application delivery issues.
- Integrate applications seamlessly with Service Map and other out-of-the-box dashboards and visualizations for a faster resolution and release.
Datadog tracks every request for an app and monitors its delivery. This involves looking at events in the application stacks. Alerts are triggered when there is an anomaly in the application’s delivery. These alerts will accumulate so that you can instantly see which application is having trouble and which service is the culprit.
#4. AppDynamics
Best for production environments that offer an agile approach to recording details of transactions.

Cisco’s AppDynamics is a powerful observability platform that also includes a SaaS APM solution. It is designed to assist organizations in ensuring their apps work efficiently.
It is suited for larger companies. AppDynamics monitors application performance, then extracts insights into how it impacts business operations. AppDynamics gives you full visibility into how your business is performing, from data collection through processing to deriving insight from that data.
Features:
- This platform supports a variety of languages, including Java,.NET and PHP. Node.js is supported as well as C/C++ and Python.
- It monitors your application software in real-time and compiles historical data to enable it to establish a baseline for standard performance. If your software is performing poorly, this alone may prompt you to adjust your capacity provision.
- You can see the user experience module and where your services are most in demand. This tool is great for both business analysis and application performance monitoring.
- With AppDynamics, you can easily identify the root cause and fix it.
Appdynamics uses Alerts and Responses to automatically detect what is normal about the performance.
#5. Stackify Retrace
Best for code-level tracing, squashing bugs, and continuously observing and improving your application’s user experience from dev to production.

Retrace is an inexpensive SaaS APM tool for developers. It’s designed to assist developers in optimizing the performance of their applications in quality assurance and “retrace”, application problems in production using very detailed code-level transaction traces. Retrace is easy to use and affordable for developers of all sizes. It integrates with your .NET, .NET Core, PHP, Node.js, Ruby, Python, and Java stacks, as well as supports dozens of the most common frameworks.
Features:
- Track deployments automatically with your CI/CD tool.
- Reduce MTTR and resolve exceptions with improved visibility into legacy code, poor-performing dependencies, framework sections, and hidden exceptions. Retrace dramatically improves the app’s performance and IT efficiency by integrating code profiling and error tracking with powerful APM.
- Combine web requests, SQL queries, and HTTP calls across all logs
- Streamline troubleshooting, issue resolution with aggregated application and server logs, and enhanced search and drill-down capabilities.
- Use log tags and structured logging to analyze more effectively.
#6. New Relic
Best for monitoring your entire stack on a single platform.

New Relic is a leader in the field of application performance management and has been a champion of the SaaS-based APM. New Relic offers APM for mobile apps as well as advanced browser performance monitoring and, most recently, added infrastructure monitoring.
It’s designed to assist modern application teams in leveraging the latest technology trends to move quicker – reducing costly downtime and increasing engineer productivity confidently to enable high-performing apps.
Features:
- Engineers can quickly set up visualizations to provide opinionated insights about their applications in a variety of languages using New Relic’s SaaS platform.
- New Relic’s depth of data collection is complemented by several avenues for custom instrumentation. These include API calls to agents from within your source code, XML-based custom instrumentation modules that are packaged with deployed applications, and UI-based instrumentation addition without a code deployment.
- The Relic platform gives clear visibility into end-users experiences through real-user monitoring and synthetic monitoring. Mobile app performance analysis can be used to link front-end performance with server-side performance.
- New Relic Health Map gives you a high-density, prioritized view of your applications and a clear linkage with the infrastructure hosts on which they depend.
#7. eG Innovations
Best for monitoring the performance of your Cloud, SaaS, and Enterprise applications.

eG Enterprise is an APM solution that monitors the performance of your application and its supporting infrastructure. It can be used to quickly identify the root cause of performance issues wherever they occur. It is an end-to-end performance management solution that enables enterprises to detect, diagnose, and resolve application performance issues before end-users are affected.
Features:
- Be the first to know when users experience a negative digital experience by monitoring their use of applications.
- eG Enterprise employs a tag-and-follow approach. It automatically tracks user access from mobile apps and web browsers to application servers and pinpoints the server component that is causing slow business transactions.
- Get code-level insight into applications with distributed transaction tracing. Find reasons for slowness, such as code errors, slow remote calls, and slow queries.
- Get deep-dive performance insights into your application infrastructure, including JVMs and CLRs, application servers, as well as message queues, databases, and other services.
- Find the root cause behind performance slowdowns with built-in correlative Intelligence and machine learning.
#8. Site24x7
Best for monitoring application performance across cloud, virtual, and physical servers.

Site24x7 Application performance monitoring platform allows you to analyze the performance and stability of various platforms such as Java, Node.js, Ruby, PHP, and.NET. It offers end-to-end observability by tracking important application performance metrics to monitor as well as optimize the performance of your application in real time.
It supports any application regardless of its location or technology. It provides perfect end-to-end monitoring. This includes front-end, backend, real user monitoring, server level, API, code level, log monitoring, and network device monitoring.
Features:
- Site24x7 Insight allows you to drill down to the line of code and locate the needle in a haystack. This low-level analysis allows you to identify bottlenecks and program methods that are slow.
- 50+ metrics allow you to compare how your application performance affects end-user experience.
- With the help of distributed trace, you can troubleshoot microservices and distributed architecture easily.
- AI-powered APM Tool that allows you to identify unexpected spikes in application performance.
Site24x7APMInsight allows you to understand the behavior of your applications and create a seamless digital experience for customers.
#9. Sematext APM
Best for real users and end-to-end monitoring.

Sematext APM gives you real-time, end-to-end visibility of web application performance. It tracks individual and business transactions and helps you identify the most underperforming areas of your application. It speeds up troubleshooting and improves user experience.
Features:
- View a complete resource waterfall view to see which assets are slowing down your pages, as well as a detailed load time analysis.
- Sematext Cloud offers such capabilities through custom instrumentation. This allows you to easily create custom pointcuts.
- Monitor APIs and websites behind the firewall using a private agent deployed within your network.
- Track your Apdex Score and identify performance bottlenecks to ensure user satisfaction.
Sematext APM provides a map-like representation for your entire application architecture. You can see inter-component communication, their throughput, latency, and error rates, as well as connections to databases and external services.
#10. Opsview
Best for database monitoring.

Opsview is used by businesses to monitor the performance of their applications. Opsview provides information about the performance of your applications and offers solutions for user system issues. It also shows you how to improve your services to end-users.
This APM tool is ideal for businesses that want to scale multi-tenancy features and ensure the APM tool’s scalability. It supports APM packs and plugins that are compatible with VMWare and Microsoft Azure as well as Amazon Web Services.
Features:
- It monitors apps, virtual and cloud environments, databases, hybrid infrastructures, servers, websites, and applications. It offers standard monitoring functionality, as well as autodiscovery or autoconfiguration capabilities.
- Opsview Application Monitoring tools provide a single view of all infrastructures and the performance of business applications. Digital technology can be complex as multiple applications may be deployed in different locations. It can be difficult to show performance data in one context.
- Opsview monitors application health and sends out alerts when it’s not normal. This is done before the end-user’s device is damaged.
- It monitors the availability of databases, connectivity to clients, and storage metrics.
- Opsview ensures that critical business applications meet all the necessary SLAs.
#11. Scout APM
Best for 24-hour monitoring of all infrastructure.

Scout is one of the best APM tools for troubleshooting IT infrastructure. It can detect and fix bugs that are affecting performance before they reach the end user. It provides an APM-only solution to analyze the performance of applications that were built in Ruby, Elixir, and Python. This allows you to identify commonalities among slow requests, tie bottlenecks back to the source code, analyze overall backend performance, and
It also uses an intuitive mechanism that pinpoints issues in the source code. Scout APM can detect and fix bugs such as memory bloat, n+1 queries, and latent databases.
Features:
- It uses the developers’ trace feature, which allows other developers to quickly track the developer of a particular code and contact them to resolve the issue immediately.
- Users can easily analyze increased response time with intuitive and easy-to-use dashboards that help you drill down into individual endpoints, requests, and paths, as well as users tied to your slowdowns.
- Its real-time, content-reducing powerhouse Crossfilter enables users to efficiently identify commonalities across slow requests down to the user level.
#12. Dynatrace
Best for application monitoring, infrastructure monitoring, digital experience, and application security.

DynaTrace (formerly known as CompuwareAPM) is the first self-learning Application Performance Monitor tool. It provides automatic topology visualizations for applications and components through its agent. DynaTrace is a powerful application performance tool. It offers automatic observability at scale for cloud-native workloads and enterprise apps to help you ensure end-to-end hybrid cloud-distributed tracing, optimize service performance, collaborate efficiently, and deliver more value with less effort.
Features:
- It illustrates application topology and changes in real-time, leveraging AI to detect performance problems as well as reduce MTTR (Mean Time to Recovery).
- Automatically capture transactions across every tier, down to the code level. Dive deep in order to analyze and optimize performance for improved user experience.
- It visualizes process-to-process dependencies by capturing network communication data—usually a black hole in other APM tools.
- You will still need to install the element, even if you use the system online. This element is called OneAgent. This monitor collects data and reports it back to the analytics engine. It may be located on your server or remotely operated by Dynatrace. OneAgent monitor can be installed on Windows Server, Windows Server, Linux, and Unix.
Its synthetic monitoring featuresimulates user actions and can generate expected visitor numbers. This tool is helpful when you want to add pages or services to your website.
#13. Loupe
Best for people and companies whose software is built on the .NET framework.

Loupe is a lightweight APM software that can be hosted in your data center or sent to you via the cloud as a SaaS. You can integrate the platform with other tools in your tech stack. The platform captures telemetry, so you have all the information you need to fix problems quickly.
Loupe is a monitor for .NET applications and will provide you with the most pertinent information to resolve them quickly.
Features:
- Loupe records exceptions, trace events, and performance metrics. This allows users to find root causes and fix bugs.
- Loupe tracks the hardware and operating system details where your application runs, letting you comprehend what you need to target your next version too.
- The dashboard shows events and key metrics. Users can drill down into individual sessions, events, users, machines, or users to view the full session log, performance metrics, and trace events.
- Loupe allows you to track usage across multiple versions of Loupe. Users can also assign release types and captions.
#14. Dotcom-Monitor
Best for end-to-end application performance monitoring.

Dotcom-Monitor provides complete monitoring of application performance, from web pages and front-end applications to server metrics and infrastructure. Global observability at scale is possible for your web services, applications, and network infrastructure. From a single dashboard, you can see all of your pages, applications, services, and infrastructure.
Features:
- Supports web applications frameworks and languages such as HTML5, AJAX, and Flash.
- Integrate with third-party alerting and incident management tools such as PagerDuty and Splunk On Call, Slack, and ServiceNow.
- Apps that use external identity management or single sign-on, such as OKTA and Azure ADFS will be supported.
- You can easily create scripts that monitor web transactions critical to your business, such as shopping carts and portal logins.
#15. LogicMonitor
Best for intelligent observability for modern applications.

LogicMonitor is a SaaS-based and web-based APM software. It is also a hybrid agentless monitoring system, which makes it easy to track the performance of the process. LogicMonitor can monitor complex, multi-cloud, and hybrid enterprise infrastructures at a global scale.
Features:
- To troubleshoot quickly, automatically map and visualize the relationships among microservices components and application components.
- Unknown impacts on application performance can be eliminated with container monitoring and public/private cloud.
- Root cause analysis automatically detects the relationships between monitored resources in order to reduce alert fatigue and improve MTTR.
- Multi-step Synthetic transactions can be recorded and uploaded, allowing customers to identify issues before they are reported.
- Implement digital transformation projects using ITOps & DevOps that can correlate signals across applications and infrastructure to business outcomes.
FAQ’s – Application Monitoring Tools
Which APM Tool is best?
The top 12 APM tools are 1. Datadog, #2. AppDynamics, #3. Stackify Retrace, #4. New Relic, #5. eG Innovations, #6. Site24x7, #7. Sematext APM, #8. Opsview, #9. Scout APM, #10. Dynatrace, #11. Loupe, #12. Dotcom-Monitor, #13. Traceview, #14. LogicMonitor
What is an APM Tool?
An application performance management (APM) tool is a software program that helps organizations monitor and optimize the performance of their applications. APM tools provide visibility into how apps are performing and identify bottlenecks that can impact performance. Additionally, APM tools can help teams troubleshoot issues and diagnose problems.
Conclusion
Finding the right application performance monitoring tool can be a daunting task. But it’s worth taking the time to find one that fits your needs, because an APM can save you a lot of headaches down the road. We hope this list of the best APM tools for 2023 has been helpful in your search for the perfect tool for your business. Thanks for reading!
Related posts:
- Best DevOps Monitoring Tools
- Best DevOps Tools
- Best Continuous Testing Tools
- Agile Vs DevOps: Everything You Need To Know
- DevOps vs QAOps: Everything You Need To Know
- Best Free Disk Partition Software to Manage Windows Hard Disks
- Best Firewall Audit Software
- Best Firemon Competitors
- Best Network Security Policy Management Tools
- Best Help Desk Software
- Best DevOps Monitoring Tools
- Best IT Automation Tools
- Best Symantec DLP Alternatives
- Best McAfee DLP Alternatives
- Best Forcepoint DLP Alternatives
- Best Digital Guardian DLP Alternatives And Competitors
- Best Device Control Software
- Best Data Loss Prevention Software
- Best Burp Suite Alternatives (Free and Paid)
- Best Nessus Alternatives
- Best Vulnerability Assessment Scanning Tools
- Best IT Asset Management Software

