Debugging Test Case – Katalon Studio | Software Testing Material
Katalon Studio provides users the capability for debugging test scripts. Its Debug mode is designed to make debugging easy to use, allowing users to quickly investigate the issues that cause failure for their automation tests.
The following presents the basic steps to debug a test case:

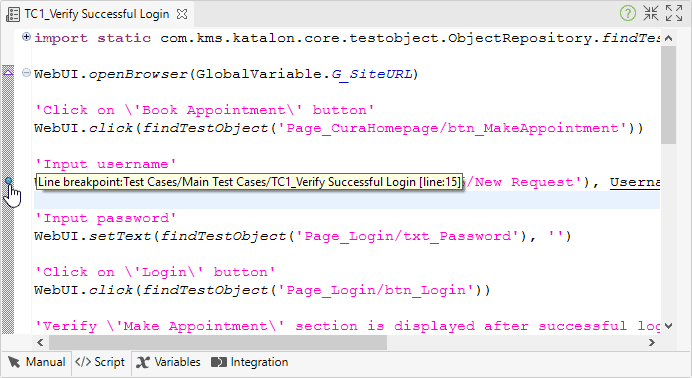
1. Open a test case and switch to the Script view.

2. Double click on the left-most side of the script editor to mark a breakpoint for the step you want to start debugging from.

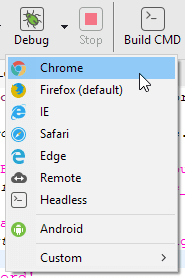
3. Choose the browser for Debug from the main toolbar.

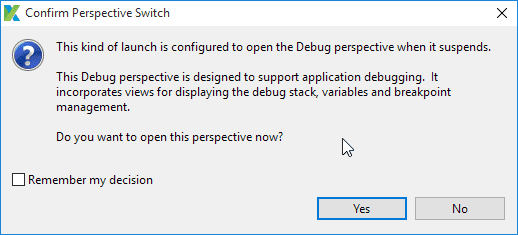
4. Confirm (select Yes) when asked to show the Debug perspective.
5. The Debug perspective provides users with helpful options for the debugging purpose. Users can:

Navigate execution using commands from the debug toolbar.
Where:
| Command | Description |
| | Resume debugging |
| | Suspend debugging |
| | Terminate debugging |
| | Disconnect |
| | Step into current code block |
| | Step over current code block |
| | Return from current code block |
| | Run to specific line |

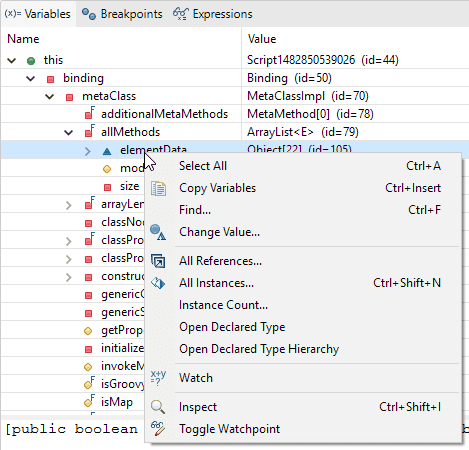
Track values of variables using Watch utilities.
Where:
| View | Description |
| Variables | You can view all variables associated with the current debugged action using Variables View. This is similar to Variables View in Eclipse. Refer to this guide for more details. |
| Breakpoints | You can view all breakpoints using Breakpoints View. This is similar to Breakpoints View in Eclipse. Refer to this guide for more details. |
| Expressions | You can inspect data using Expressions View. This is similar to Expressions View in Eclipse. Refer to this guide for more details. |
6. Stop execution when you complete debugging.
Although the debugging mode in Katalon Studio is very similar to that of the popular Eclipse IDE, we manage to retain just enough function to keep the UI clean while providing users with all required options to investigate issues when needed. If you have any suggestion or need any support, please send your request here.

