Monitor Collections in Postman

In the previous articles on Postman Tutorial, we have covered “Data-Driven Testing in Postman“
In this “Monitor Collections in Postman” article, I will be demonstrating how you can implement this concept and get a tight grip over this.
What is Monitor in Postman?
A Postman Monitor runs our collection on the Postman cloud. It is a web client that allows us to send scheduled API calls to the deployed APIs that we have created. Monitor allows us to obtain statistics on the performance of APIs.
A monitor can be set on Collection with single/multiple requests having tests. It also allows us to make calls from different regions around the globe. It is scheduled to run hourly, daily, weekly. Reports can be shared over email if the user has selected an option to send failed requests/errors over email.
An important point to note here is that sign-in is required in postman to use Postman Monitor. Once you have signed in to Postman, we can create a Monitor to run our Collection based on the frequency of our choice.
Creating a monitor:
We can create a monitor using 3 ways:
- Creating a monitor with the New button at the top right corner – Click New > Monitor
- Through the Collection itself by clicking the ellipses.
- Click on arrow button besides Collection to be monitored
- Let’s say we have opted for method 2 of creating Monitor i.e., Creating a monitor via a collection. It populates the information in that collection.
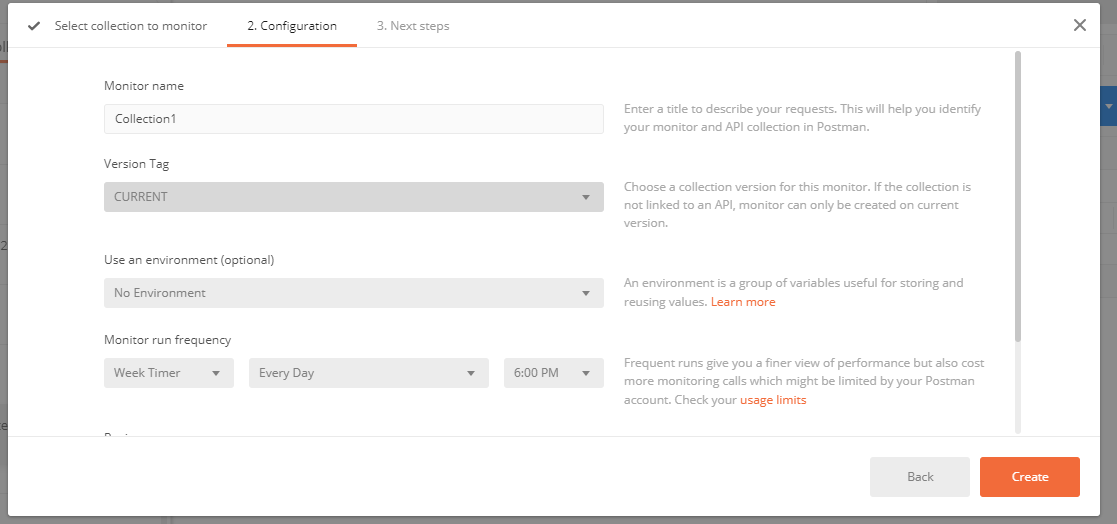
- If we click on the Back button, there are options to choose an existing collection or creating a new one.
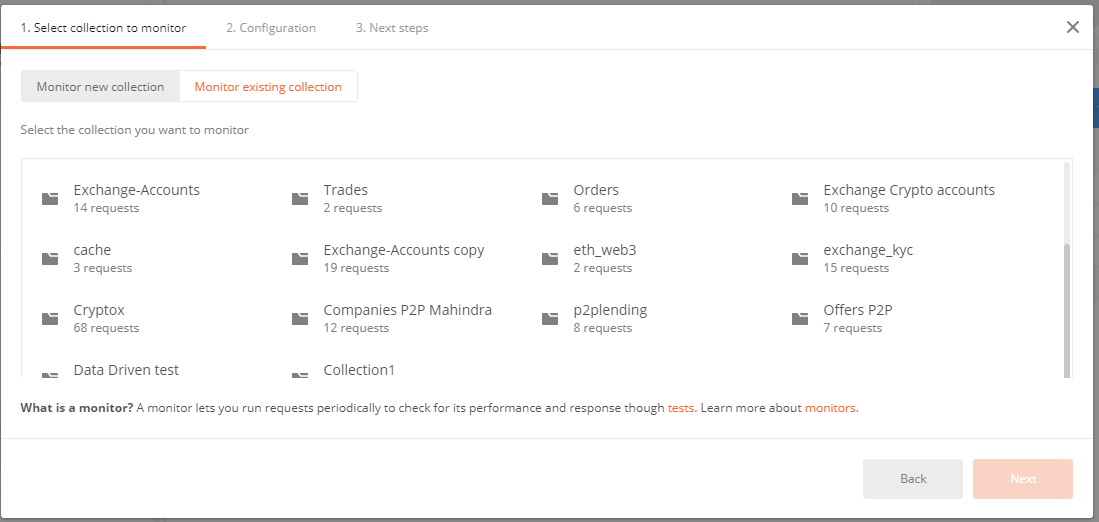
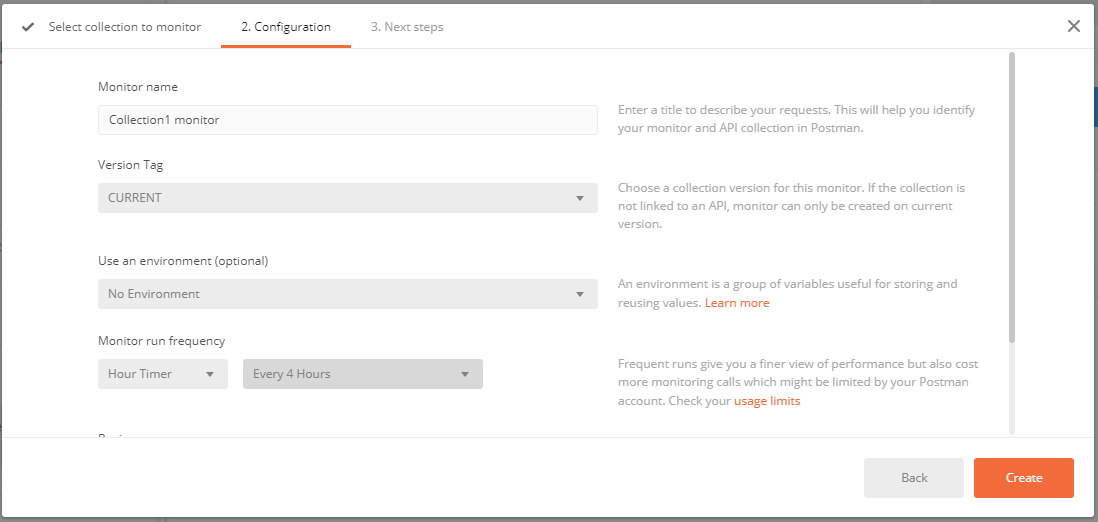
- After selecting a collection to be monitored, enter Monitor name, Environment name. Then the important part of the postman monitor is Monitor run frequency. This allows us to choose something like an hour timer or a weekly timer. We can schedule our API execution through Monitor run frequency.
- We then have the Region option which allows us to choose where our APIs would be called from. You need to upgrade plan to use Manually Select Region option.
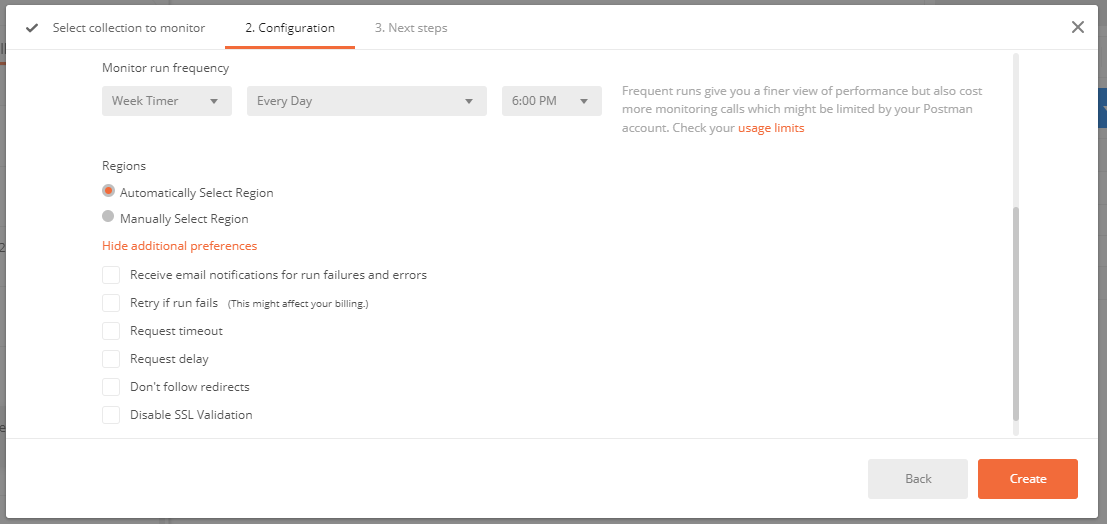
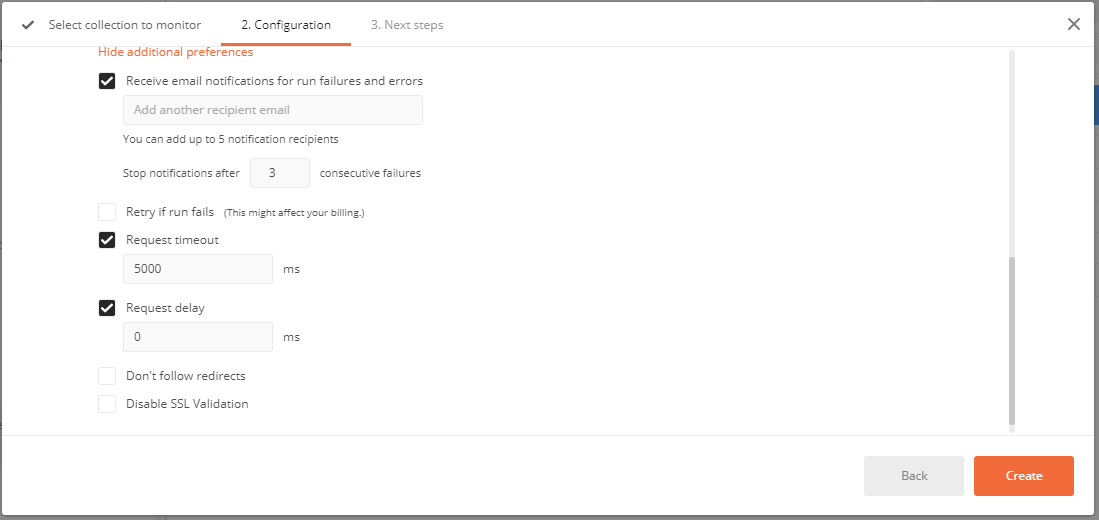
- Lastly, under additional preferences, we have a few other things.
- We have email notifications on run failures/errors. If any tests fail we will get an email notification.
- We have retry if run fails. Failed monitor runs will only be retried if the previous run was successful.
- We have a Request timeout. If API is taking too long time to respond, it will automatically timeout the request and that would be a failure.
- We have a Request delay. If we have multiple requests in our collection, it will delay the execution of the next request by this much time.
- We then have Don’t follow redirects. If we have a specific API call where we are looking to get a redirect back, this option will help so that we can see that we are receiving that redirect.
- And lastly, we have Disable SSL Validation. It allows us to shut off the SSL validations such as if we did not put a certificate on our server and it will not check to see if SSL is on because otherwise if it does and it’s not there, it will send a failure.
Results:
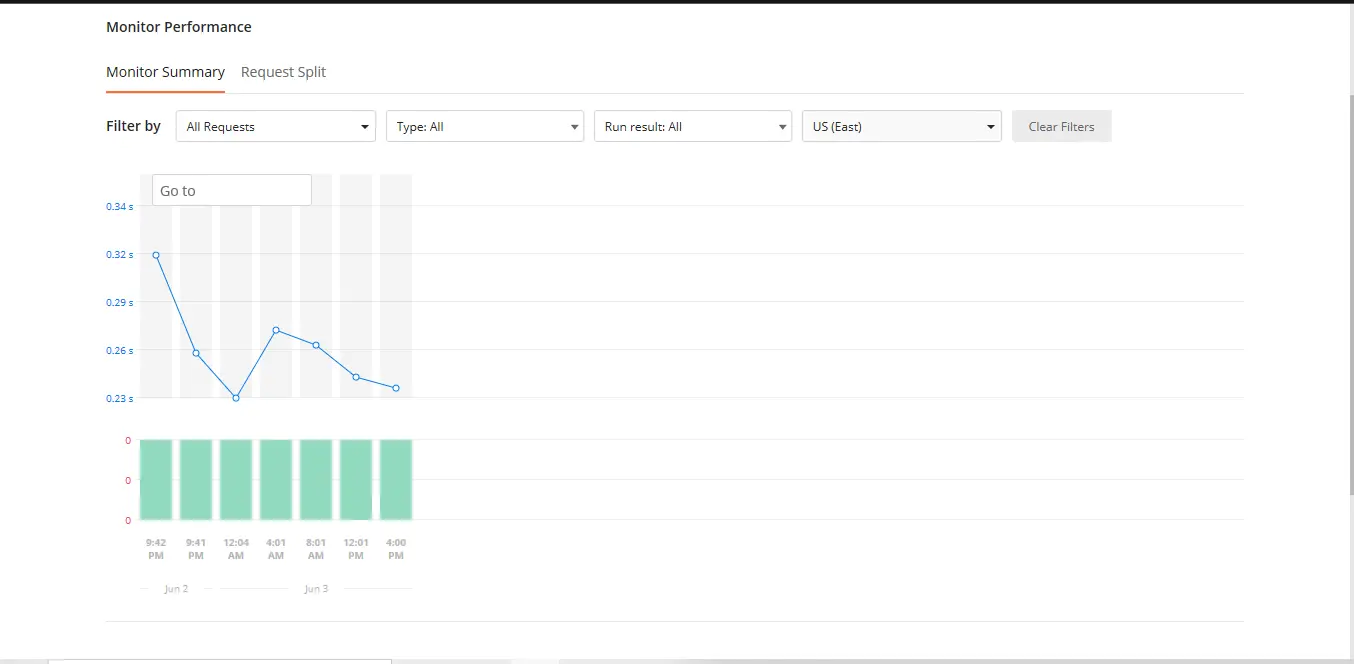
Web dashboard shows the Monitor where we get to review the statistics and results. On the left of this graph, we have seconds that it took to perform, and then at the bottom, we have at what time these calls perform. These are in chunks and the line is an average of or an aggregate of the response time. When we hover mouse on these chunks, it will give us the failed percentage and average response time.
We can filter out our requests with various options available such as to request name, type of the request, Run result.
If we want to see all the requests separated by different lines, we can use the Request Split option.
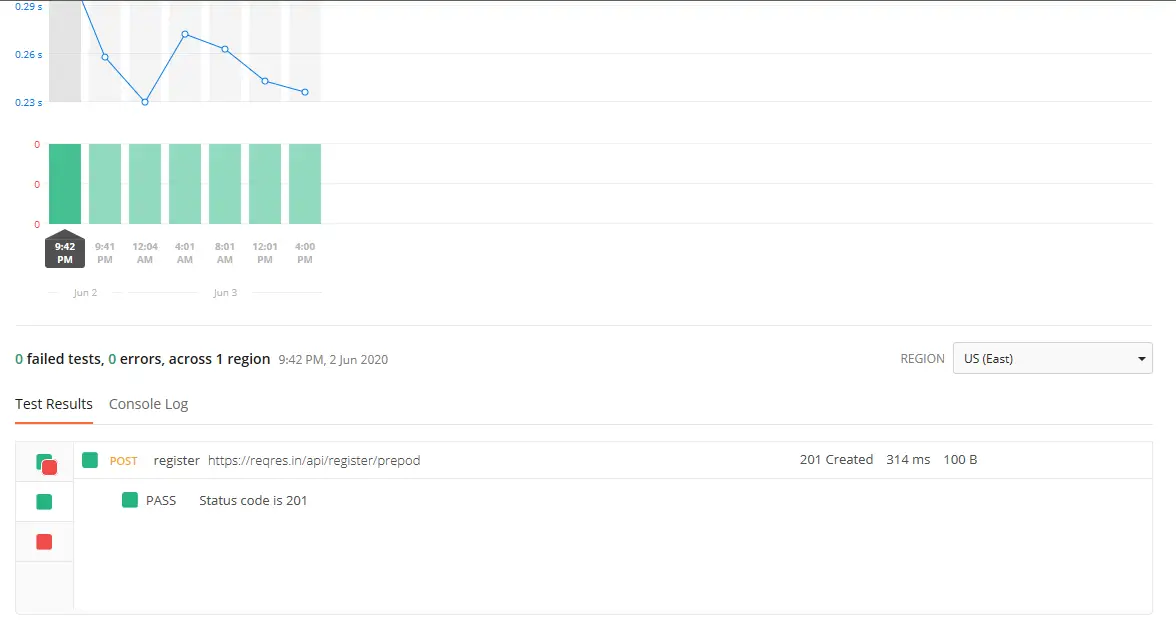
If we want to see more data like what tests passed and what tests failed and what was all executed during this run, we can click the bar graph and get all the details. Green shows passed tests. Red shows failed tests.
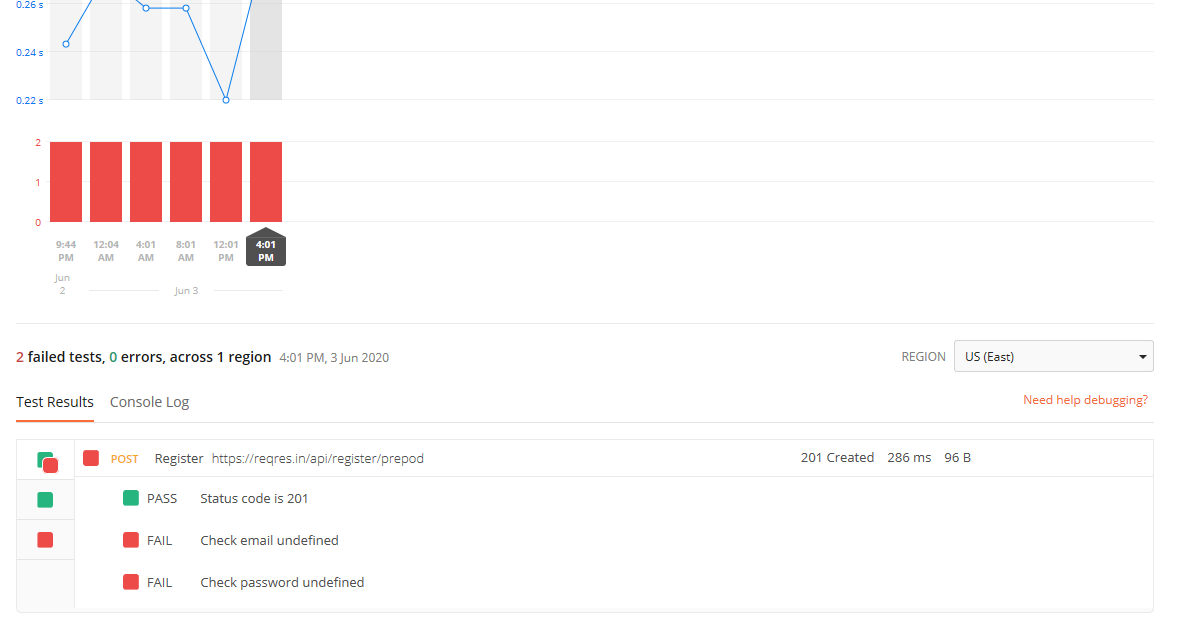
To the right are the HTTP status code, response time, and response size. Also, we can see more information on what actually was sent through and what we got back through the Console log. Click on the Console Log tab on the right of the Test Results tab.
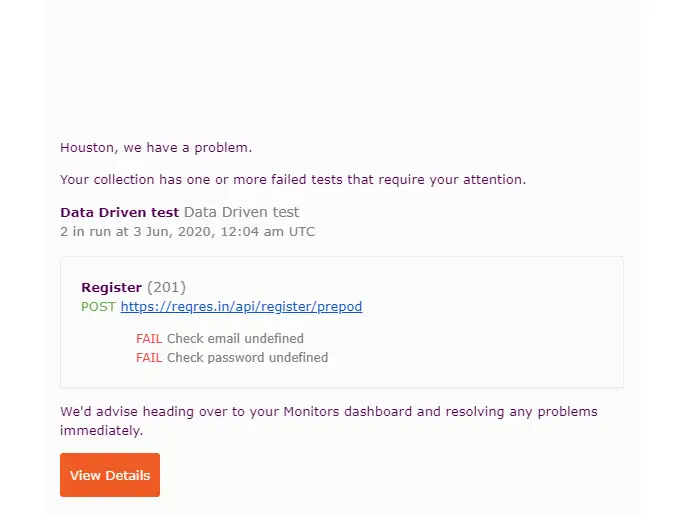
We get an email from postman monitors regarding errors i.e. what tests are failed.
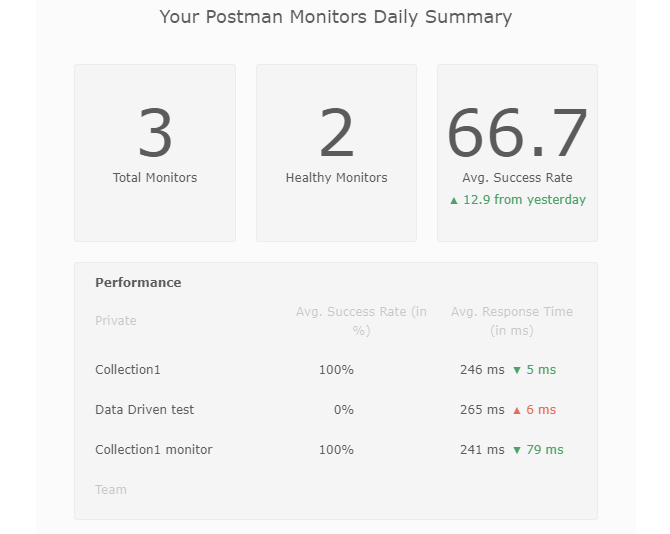
We get an email from postman monitors as a summary of how all of our executions performed.
Next steps:
Learn “How to run Collections Remotely (with URL)” in the next tutorial.
Related posts:


