How to Debug Collection Run in Postman
In the previous articles on Postman Tutorial, we have covered “How To Run Collections from Jenkins“
In this “How to Debug Collection Run in Postman” article, I will be demonstrating how you can implement this concept and get a tight grip over this.
To debug the collection/request, Postman provides the Postman Console feature.
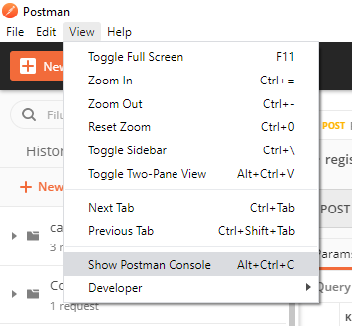
1. Show Postman Console option is in the View tab on the top. We can also use the keyboard shortcut Alt+Ctrl+C
2. Also, we have an icon of Postman Console at the bottom. Click on the icon. It will open the Postman Console window.

3. Now, whatever request we will run, it will be logged in the console window. Send an API request. Check logs in the console window. All the request headers, body, response headers, response body, status codes, response size, and all the script outputs will be logged in the console window. If there is any variable used in the request, their actual value will also be shown in the Console window.
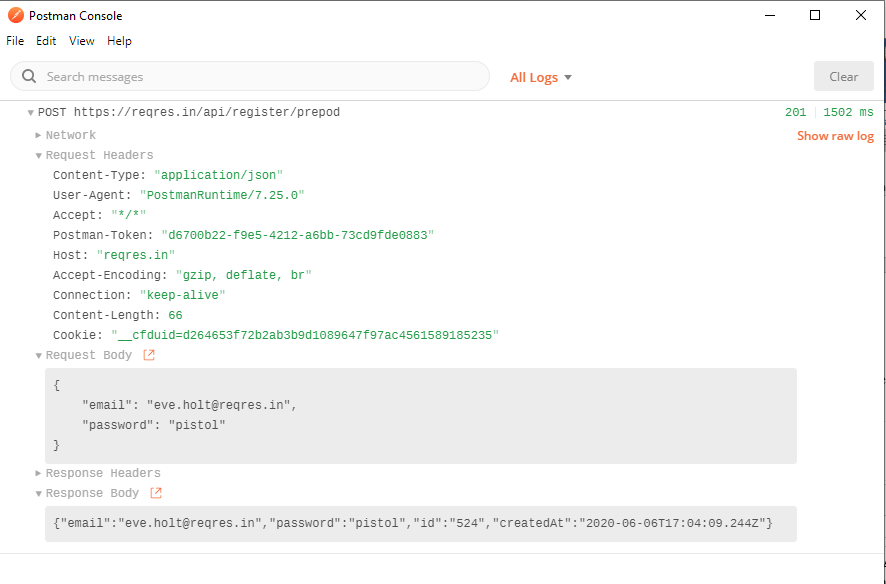
4. Expand the response headers, network, request headers, body to view the data.
5. We can also select the raw format and pretty format from the option in right.
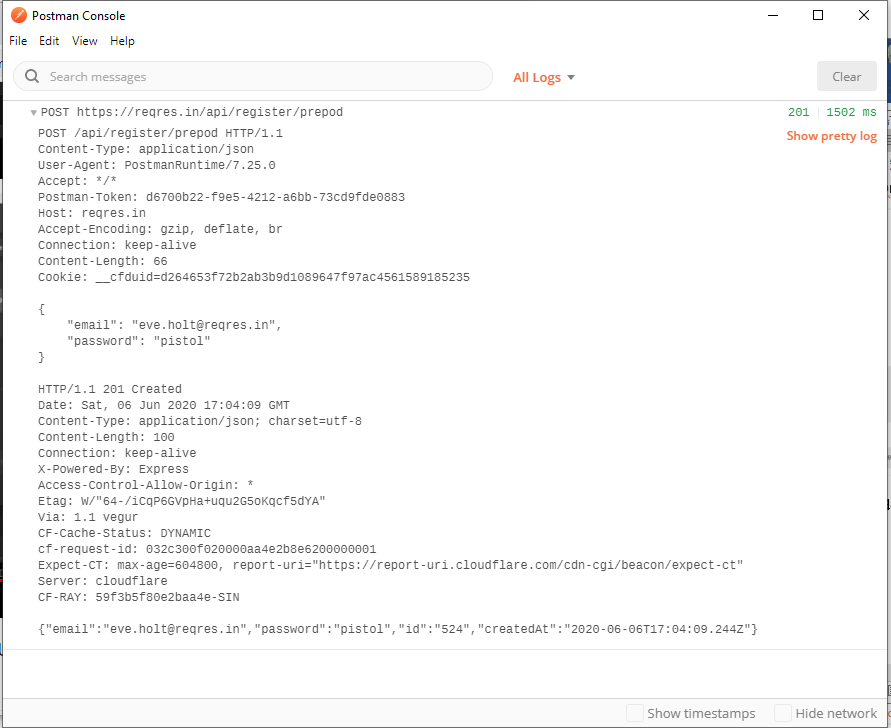
6. We can also access errors/info/warnings/logs separately from the Console window. There is an option of Clear too to clear the logs displayed.
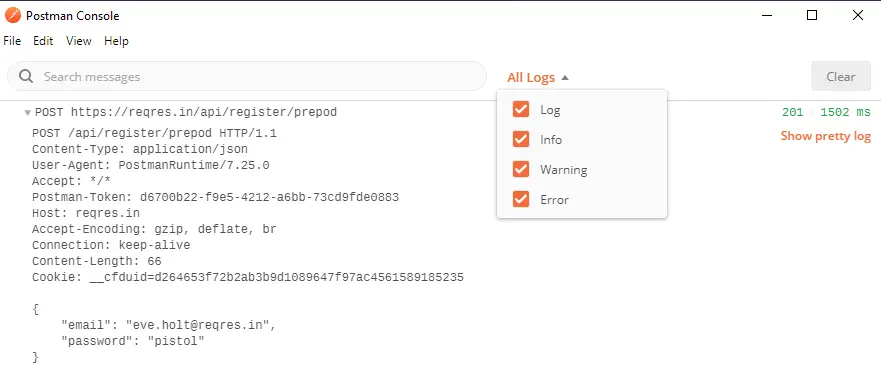
7. Also, we can use console.log(), console.info(), console.warn(), console.error() statements in Pre-request scripts or Tests scripts to log on to the Postman console.
Next steps:
Learn “Generate Newman Reports on Jenkins” in the next tutorial.
Related posts:

